Most embedded development tools come with some sort of debugging aid. For example, an integrated environment such as the Metrowerks IDE can be used for setting breakpoints and stepping through the source code in an embedded device. Many of these debuggers run in so called freeze mode, thus effectively stopping all tasks when a breakpoint is hit. It is for this reason common to instrument the code with printf's such that one can debug or trace the code without halting the target.
Using printf in an embedded device is sometimes a challenge as not all devices have a console.
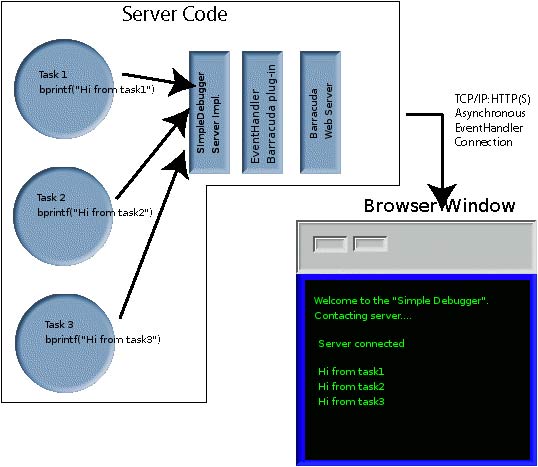
It is very easy to create a trace library using the Barracuda Web-Server and the Barracuda EventHandler plug-in. A browser window will be used as the console. By connecting a browser to the server and using the persistent connection feature of the EventHandler, the trace data can be sent in real-time from the server to the browser window.
The following print functions will be created.
The functions bprintf and bvprintf works just like the ANSI C printf and vprintf functions, except for the first argument, which is the message priority. The trailing 'b' in the function names is short for browser window -- i.e., the message is sent to a browser window and not the standard console. Data is not immediately sent to the client, but is buffered in the server code. Function bflush flushes whatever data that is in the buffer to the client.
The client side of the simple debugger cannot be constructed using static HTML. A client side application using the EventHandler must be implemented in JavaScript (ECMAScript). A client application that can dynamically change the GUI can be referred to as Dynamic HTML or just DHTML.
A simple template for such an application is shown below.
As you can see, the HTML body tag contains no HTML elements. Elements will be added and removed to the browser's DOM by using JavaScript code. The script tag contains one event function declaration in the above example. The onload event is automatically triggered by the browser when all components of a HTML page is loaded. We will later use this function for starting up and connecting the EventHandler to the server.
A DHTML client using the EventHandler is loaded and initialized as follows:As you saw in the above DHTML template, the HTML body contained no HTML elements. Most graphical user interfaces contain parts that never change and our simple debugger is no different. We will add some HTML code to the body of the document and add most of the JavaScript code for the client.
The client can at this point be developed without using the Barracuda Web-Server since the client interface does not require server side scripting. A simple text editor and a browser is all that is needed for doing nearly all of the client side development.
Development of the user interface is ideally left to a DHTML programmer. A DHTML programmer can develop and test the GUI code offsite. At this point in the development, the server interface can be simulated. When the GUI development is completed, the stub code can be replaced by the interface functions defined in the EventHandler Interface Definition File.
We have added some stub functions (test code) to the Simple Debugger such that we can test some of the functionality without the server. Please open the Simple Debugger Test Code.
The Simple Debugger Test Code prints out "Contacting server....", but the test code will not contact the server since we have not added the EventHandler code to the DHTML test code at this stage.
The EraseTrace button is the only code completed so far. The button simply erases all data in the client.
The Enable/Disable Trace button will eventually send an "enable/disable trace command" to the server. The Enable/Disable Trace button currently prints out some text in the console. This is used to test how text sent from the server is formatted in the console window.
The Trace Level combo box lets the user select the trace priority. A total of 10 priority levels can be set. Level 0 is the highest priority and if selected, only trace messages with priority level 0 are sent to the console.
You should now study the source code for the Simple Debugger. Right click in the Simple Debugger browser window and select "view source".
Do you have a difficulty understanding how the client side code works? Now is a good time to read up on the following technologies:The online and free w3schools.com is an excellent resource for all of the above technologies.
The next step is designing the interface definition file. Barracuda comes with an IDL compiler that can translate the IDL definition into JavaScript code and C/C++ code.
As you saw from the Simple Debugger Test Code, we have already constructed the code for the server to client interface. The EventHandler stub compiler otherwise generates the skeleton for these files.
The EventHandler stub compiler also generates some C header files and C source files. You can either generate C code or C++ code. We have used C code for this example.
The client side EventHandler code, which is in a separate JavaScript file, must be loaded into the DHTML client. The following two declarations are added to the header section.
The first line loads the EventHandler stack and the second line loads the JavaScript stubs that were generated by the EventHandler stub compiler when we compiled the SimpleDbg.ehi interface definition file.
The EventHandler and the server stub interface are created in the onload function:The first line creates an instance of the EventHandler stack. The argument is the URL to the server side of the SimpleDbgServer2ClientIntf, which we declared in the SimpleDbg.ehi interface definition file.
The next step is to add code for sending commands to the server from the local event functions. For example, the clientToggleTrace event function in the Simple Debugger Test Code can disable the trace by calling the following function:
Re-enable the trace is:
Barracuda, which is an object oriented C library, provides a C code API and a C++ code API. In this white paper, we have used the C interface.
We suggest that you read the introduction to Object Oriented programming in C code before you continue reading this white paper.
It is now time to download the example code. The example code contains all source code for the Simple Debugger and a pre-compiled executable server for MS Windows. The server starts automatically when you run the example code's self extracting ZIP file.
The source code you should study is:
| html\SimpleDebugger.html | The DHTML client. |
| src\SimpleDebugger.c | The server Simple Debugger implementation. |
The Simple Debugger implementation is designed such that only one client can be connected to the server. You can test this by opening a separate browser window and type in the URL to the SimpleDebugger. The server is a shared resource, and one must have this in mind when designing a client server application. It would be easy to change the Simple Debugger to be multi user enabled, but the purpose with this demo is to show you how a user can exclusively lock the server application.
Typically, a multi user enabled application should automatically synchronize all connected DHTML clients. For example, if one user changes the trace level in the combo box, then all connected clients should be updated. The way this works is that the client changing the trace value sends a change command to the server. The server responds by sending an asynchronous change user interface command to all connected clients.
You can download the Barracuda demo if you would like to see examples of multi user enabled applications. The Barracuda demo contains a multi user enabled slide show and a multi user enabled MP3 player.
The server side implementation of the Simple Debugger is in src\ SimpleDebugger.c.
The SimpleDebugger source code is heavily commented, but in short:
The core server functionality is encapsulated in class SimpleDebugger.
The SimpleDebugger contains the following member functions:
| newClientCon | called when a new client initiates a persistent connection. |
| clientConTerminated | called when a client terminates a persistent connection. |
| setTraceButtonState | called when the user presses the Enable/Disable Trace Button. |
| setTraceLevel | called when the user selects a new priority value in the Trace Level combo box. |
| send2Browser | Sends data to client when trace buffer is full. |
| vprintf | Works like the ANSI C vprintf function, except for that the data is sent to a browser window via function send2Browser. |
| flush | Send data in trace buffer to client. |
| constructor | Initializes all data for this class. |
JavaScript code can manipulate the DOM in the browser window, thus creating rich user interfaces. One can either use the DOM directly as we did in the Simple Debugger or use a widget library such as Bindows.
Another possibility is to use SVG. Scalable Vector Graphics (SVG) is an exciting new XML-based language for Web graphics from the World Wide Web Consortium (W3C). One can create advanced interactive graphical user interfaces using SVG. The Barracuda demo contains an example of a rich client interface implemented in SVG.
One can easily design browser based rich client interfaces that can offload the processing required in the embedded systems. Embedded systems are normally resource constrained and offloading the processing to a client can ease the burden on the embedded device. Most host computers today are very powerful and can easily execute large JavaScript applications.
JavaScript is a very interesting language and although it looks similar to C code at first glance, you will soon discover the power of this amazing language. A JavaScript application can be compressed and stored in the server. The client loads the compressed image, deflates the code and starts executing the application.
JavaScript is normally limited to the environment exposed by the browser's JavaScript engine, but our EventHandler extends the functionality of this language. One can easily design complex distributed applications using the EventHandler.